small_table = pb.load_dataset(dataset="small_table", tbl_type="polars")

validation = (
    pb.Validate(
        data=small_table,
        tbl_name="small_table",
        thresholds=pb.Thresholds(warning=0.1, error=0.25, critical=0.35),
    )
    .col_vals_lt(columns="a", value=7)
    .col_vals_not_null(columns="c")
    .rows_distinct()
    .interrogate()
)14 Reports and Extracts
After interrogation, the results need to be presented in a form someone can act on. A person reviewing the results wants a report that shows what went wrong and lets them look into the details. When you are debugging, you want the actual failing rows. Another system wants structured data it can parse. This chapter covers producing each of these. It is a different topic from reading the raw numbers in code, which Chapter 4 covered, and from responding automatically, which Chapter 13 covered.
We use one validation throughout: a plan on small_table with three checks that each fail on two rows, so every report and extract has something to show. With these thresholds, each failing step reaches the warning level.
We start with the report you have already seen throughout the book.
14.1 The tabular report
The tabular report is the main output for people. Displaying the validation object shows it, and the get_tabular_report() method returns the same thing directly, as a Great Tables object with one row per step.
validation.get_tabular_report()The left side of the report describes what was checked and the right side shows the results. The step column numbers each check in the order it was added, and that is the number you use to refer to a step in methods like get_step_report(). The columns and values columns show what was checked and what it was compared against. The test units column gives the total number evaluated, the pass and fail columns give the split, and the three status columns (warning, error, and critical) show a filled marker when that threshold was reached. Here all three steps fail on 2 of the 13 rows, which is a rate of about 0.15, so each one reaches the 0.1 warning level but not the 0.25 error level.
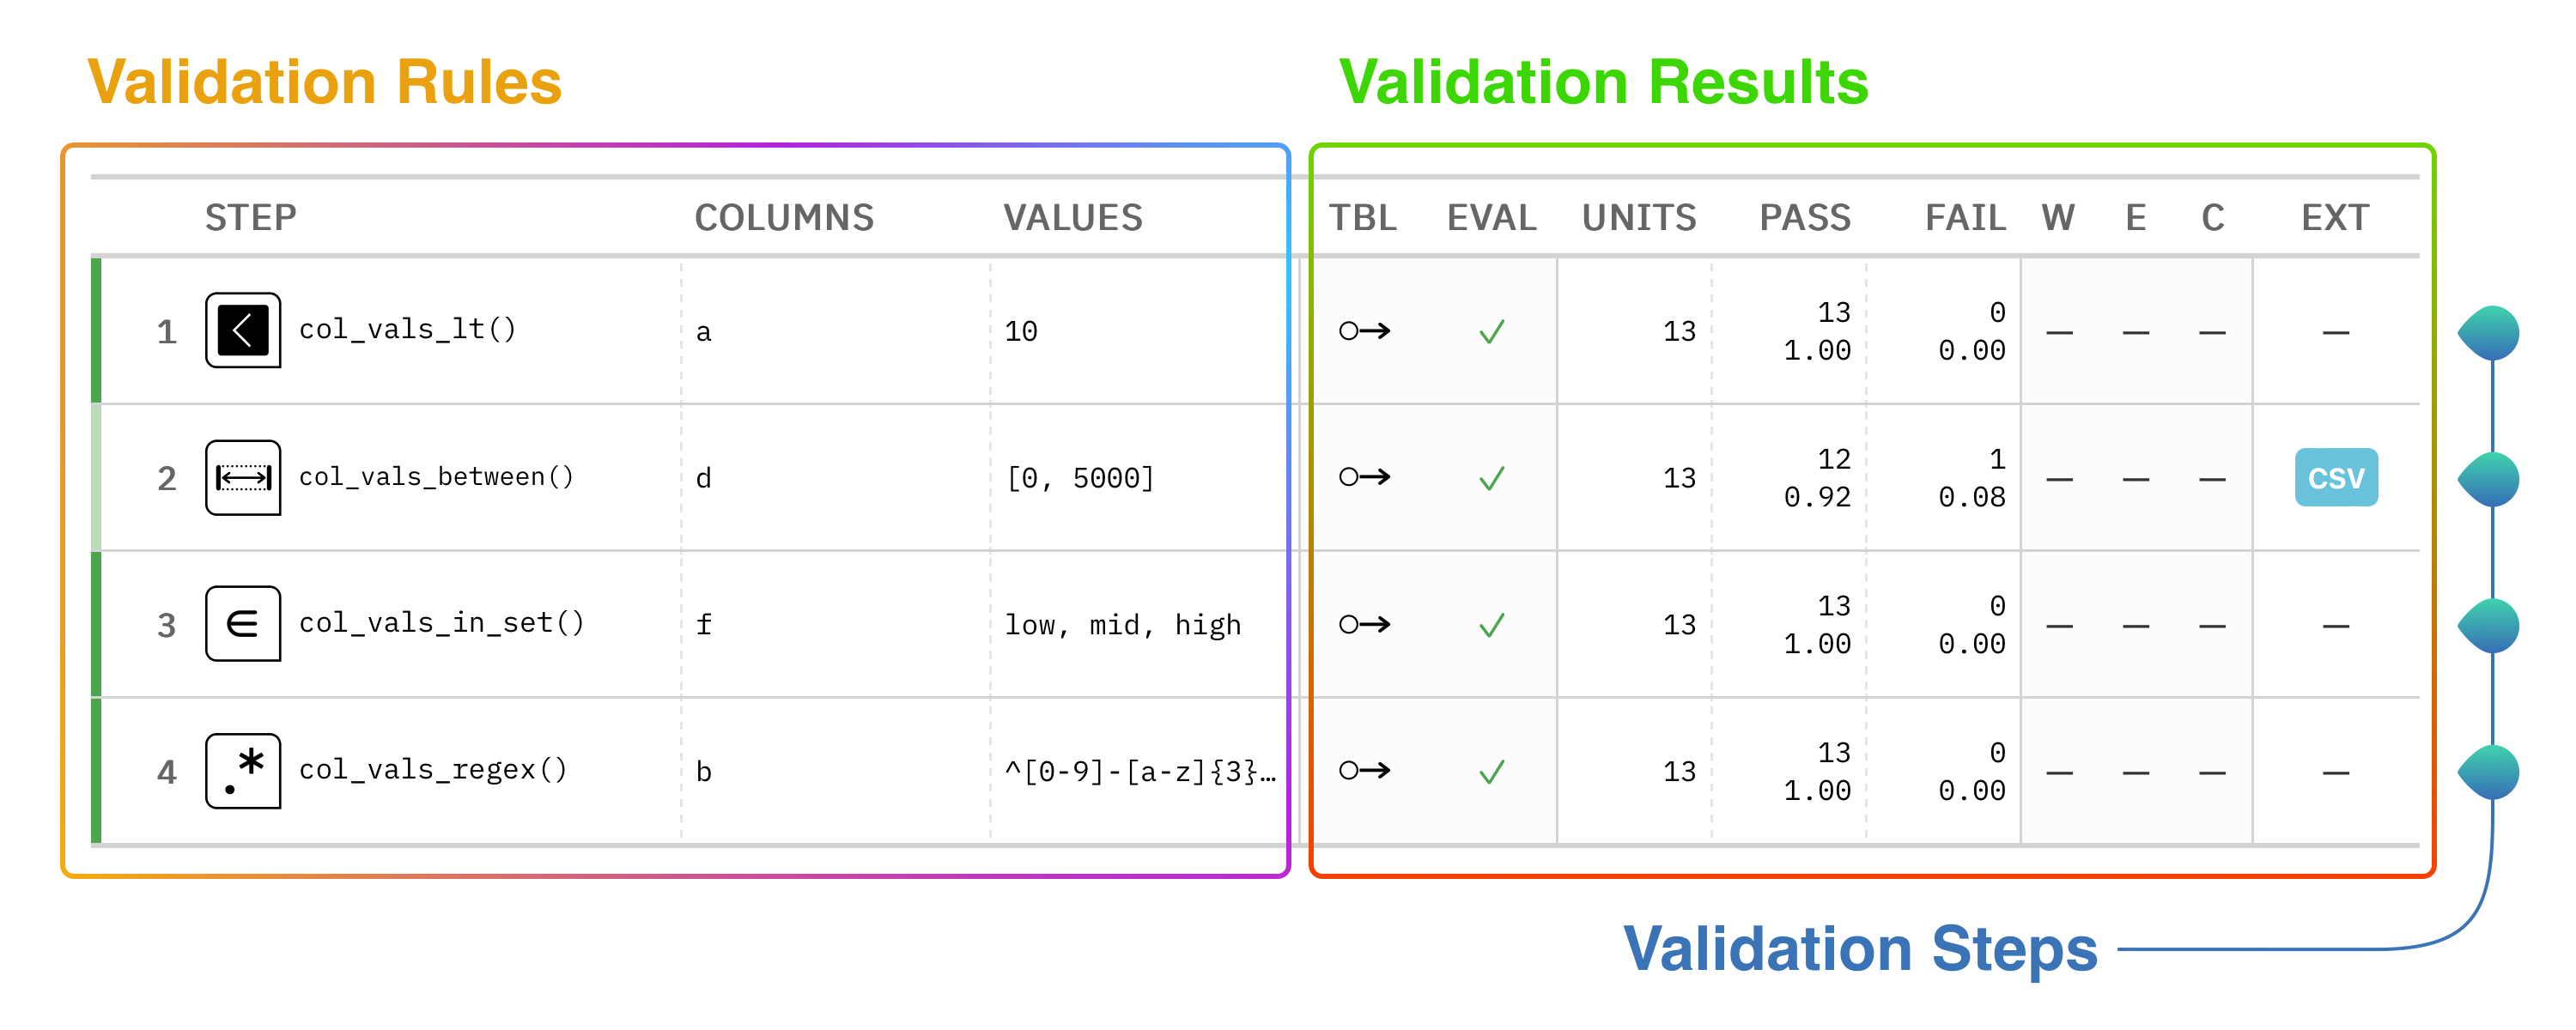
The get_tabular_report() method takes arguments that change what appears, such as a custom title= and the incl_header= and incl_footer= flags. These are the same settings that earlier chapters turned off globally with pb.config() to keep reports compact.
NoteReports are Great Tables objects
A validation report is a Great Tables object, made by the companion library that Pointblank uses for its tables. That means you can do anything with a report that you can do with a Great Tables table, such as restyle it, get its HTML with as_raw_html(), write it to an HTML file with write_raw_html(), or save it as an image with save(). If you publish reports with Quarto, set html-table-processing: none in your project configuration (this book does). That tells Quarto to leave the tables alone instead of applying its own table styling.
14.2 The report as a data frame
If you need the report’s contents as data rather than as a formatted table, the get_dataframe_report() method returns a data frame with one row per step. Use this form when you are building a custom dashboard, combining results from many validations, or passing the results to another tool.
report_df = validation.get_dataframe_report()
report_df.columns
['active',
'step_number',
'step_description',
'columns',
'values',
'step_evaluated',
'units',
'all_units_passed',
'pass_n',
'pass_pct',
'failed_n',
'failed_pct',
'warning',
'error',
'critical',
'brief',
'preprocessed',
'segmented']The data frame has 18 columns. These include the step number and description, the columns and values checked, the number of test units, the passing and failing counts and percentages, the threshold results, the brief, and whether the step was preprocessed or segmented. Because it is an ordinary data frame, you can filter it, join it to other tables, or write it to a database. For example, keeping only the steps with a nonzero failed_n and a few columns gives a short list of what went wrong.
import polars as pl

report_df.filter(pl.col("failed_n") > 0).select(
    ["step_number", "columns", "failed_n", "warning"]
)
shape: (3, 4)
| step_number | columns | failed_n | warning |
|---|---|---|---|
| i64 | str | i64 | bool |
| 1 | "a" | 2 | true |
| 2 | "c" | 2 | true |
| 3 | null | 2 | true |
The result lists the three failing steps, each with its column, number of failing rows, and warning status. The columns value for step 3 is null, because rows_distinct() looks at whole rows rather than one column.
14.4 Step reports
The tabular report gives you the overview. When a step fails and you want to understand why, the get_step_report() method shows the details of a single step. You pass it the step number from the tabular report, and it returns a Great Tables view of that step.
validation.get_step_report(i=1)| Report for Validation Step 1 ASSERTION 2 / 13 TEST UNIT FAILURES IN COLUMN 3 EXTRACT OF ALL 2 ROWS (WITH TEST UNIT FAILURES IN RED): |
||||||||
The step report shows the step’s settings along with the rows that failed it, so for the first check it shows the two rows where column a is not less than 7. You see each failing value in the context of its full row.
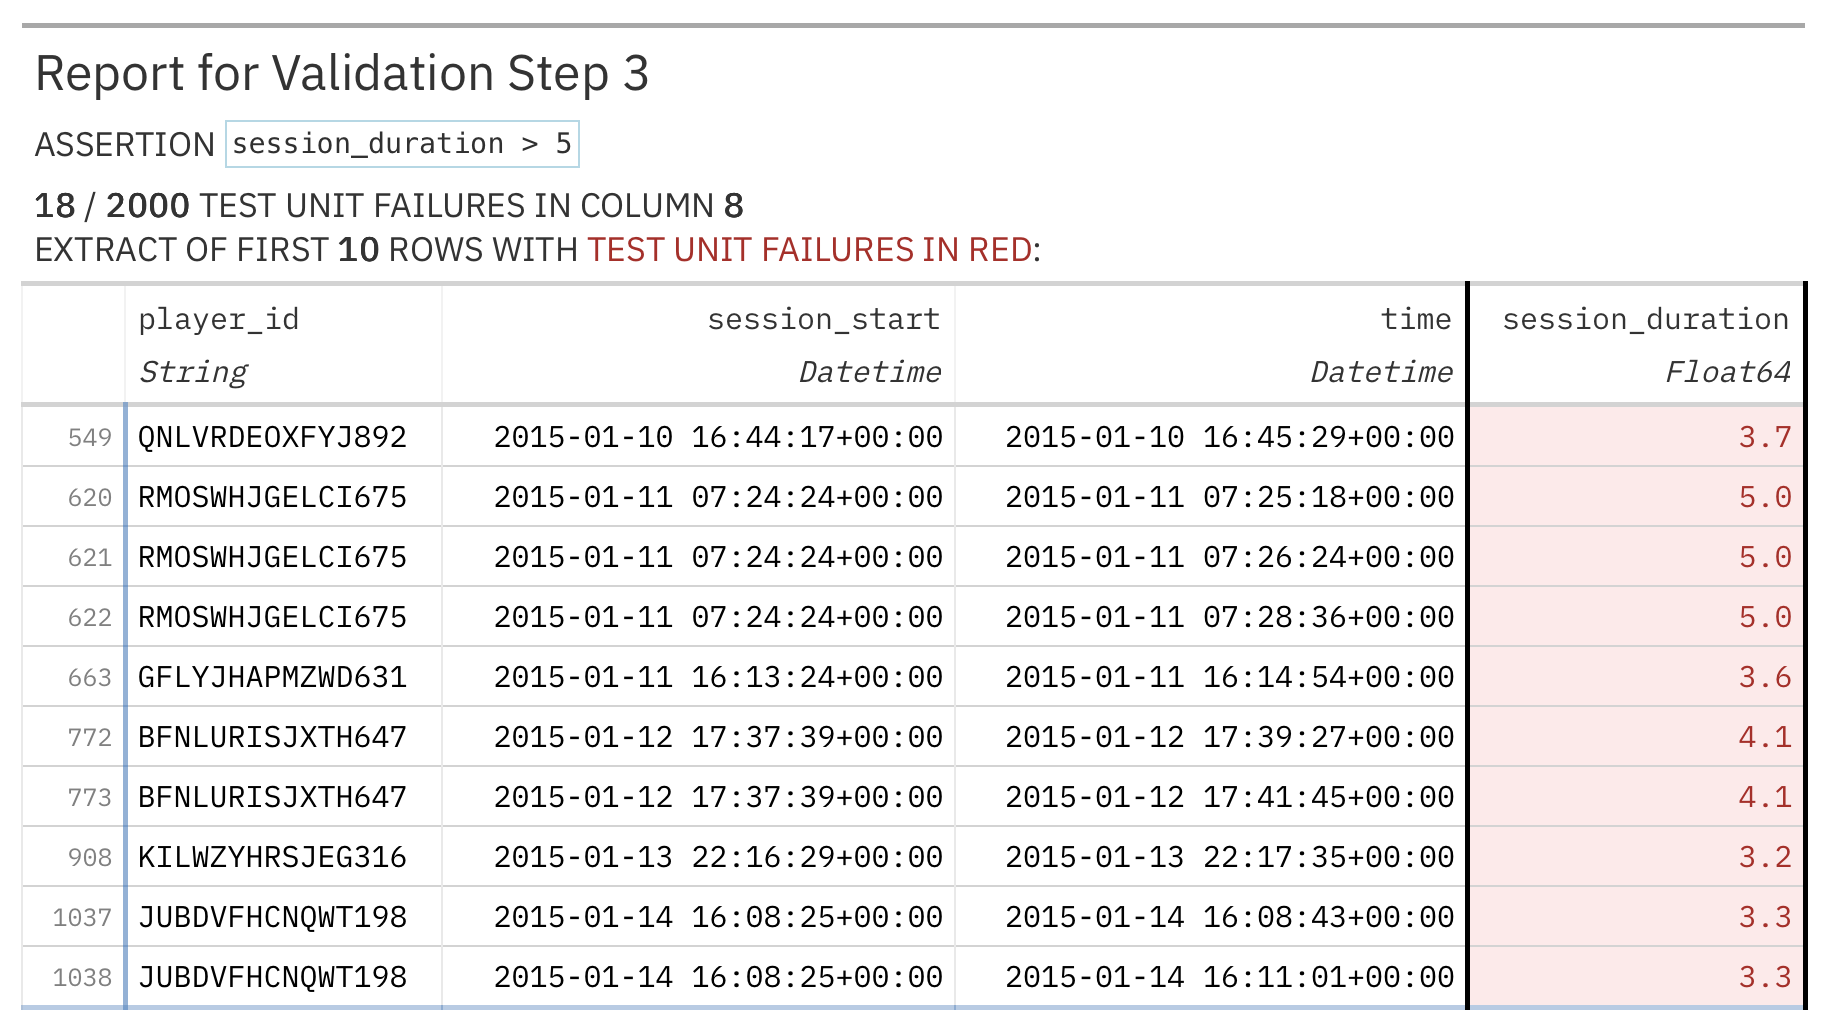
The method handles one step at a time, so to look at several failing steps you call it once for each step number, for example in a loop. The limit= argument sets the maximum number of failing rows to show. It defaults to 10, which keeps the report manageable when a step fails on many rows.
14.5 Data extracts
A step report shows failing rows in a formatted view, but often you want those rows as data you can work with. The get_data_extracts() method gives you that. With a step number and frame=True, it returns the failing rows of that step as a data frame.
validation.get_data_extracts(i=1, frame=True)
shape: (2, 9)
| _row_num_ | date_time | date | a | b | c | d | e | f |
|---|---|---|---|---|---|---|---|---|
| u32 | datetime[μs] | date | i64 | str | i64 | f64 | bool | str |
| 5 | 2016-01-09 12:36:00 | 2016-01-09 | 8 | "3-ldm-038" | 7 | 283.94 | true | "low" |
| 7 | 2016-01-15 18:46:00 | 2016-01-15 | 7 | "1-knw-093" | 3 | 843.34 | true | "high" |
The extract has the two rows that failed the first check, with every column of each row rather than just the one that was checked, so you can look for patterns in the other columns. It also has a _row_num_ column giving each row’s position in the original table (rows 5 and 7 here), so you can trace each failure back to the source.
Without a step number, the method returns a dictionary of extracts keyed by step, so you get every failing row in the plan at once.
extracts = validation.get_data_extracts()
{step: frame.shape[0] for step, frame in extracts.items()}
{1: 2, 2: 2, 3: 2}Each of the three steps has two failing rows. For step 3, those are the two copies of the duplicated row. If a step had no failures, it would still appear in the dictionary, with an empty frame, so a loop over the dictionary always sees every step.
14.6 Sundered data
An extract gives you the failing rows of one step. Sundering splits the whole table into the rows that passed and the rows that failed, which is useful when a pipeline should carry on with the clean data and set the rest aside. The get_sundered_data() method returns one part at a time, chosen with the type= argument, and each part is the same kind of table as the input.
failing_rows = validation.get_sundered_data(type="fail")
passing_rows = validation.get_sundered_data(type="pass")

print("failing rows:", failing_rows.shape[0])
print("passing rows:", passing_rows.shape[0])
failing rows: 4
passing rows: 9The table splits into 4 failing rows and 9 passing rows. As explained in Chapter 4, sundering only considers the column value checks. So the four failing rows are the ones that failed the first two steps, and the duplicate rows from rows_distinct() are not part of the split. The passing rows are the clean data you can send downstream, and the failing rows can go to a quarantine table to be reviewed, fixed, and validated again.
14.7 JSON export and programmatic access
For other systems, the get_json_report() method returns the results as a JSON string with the same per-step detail as the report. You can send it to a logging service, store it in a database to track results over time, or feed it into a dashboard.
import json

report_json = validation.get_json_report()
len(json.loads(report_json))3The JSON is an array with one object per step, so there are three here. Each object holds that step’s assertion type, columns, counts, fractions, threshold results, and timing (Chapter 4 shows a full record). If you only need individual results in Python, such as to decide whether a pipeline continues, use the methods from Chapter 4 like all_passed(), n_failed(), and critical() instead. There is no need to parse the JSON for that.
14.8 Step notes
Pointblank sometimes attaches a note to a step to record something that happened while it was evaluated. For example, a step that uses pre= gets a note describing how the preprocessing changed the table, and a schema check gets a note comparing the expected and actual columns. The get_notes() method returns all the notes for a step, and get_note() returns a single note by its key. If a step has no notes, you get None.
validation.get_notes(i=1)The first step in our plan has no notes, so the result is None. Here is a step that does have one. It filters small_table down to the rows where f is "high" before checking column d.
noted = (
    pb.Validate(data=small_table)
    .col_vals_gt(columns="d", value=0, pre=lambda df: df.filter(pl.col("f") == "high"))
    .interrogate()
)

noted.get_note(i=1, key="pre_applied", format="text")
'Precondition applied: table dimensions [13 rows, 8 columns] → [6 rows, 8 columns].'The note records that the preprocessing reduced the table from 13 rows to 6. Notes also appear in the report footer, which you can turn on or off with the incl_footer_notes= argument of get_tabular_report().
14.9 Customizing reports for readers
A default report makes sense to the person who wrote the plan, but a stakeholder who sees col_vals_lt and a column name may need more explanation. The brief= argument on each step adds a plain-language description that appears in the report, so readers can understand what a check is for without reading code. On the Validate object, tbl_name= names the data and label= describes the run, and both appear in the report header, which matters when a report is saved and viewed later on its own. Setting active=False on a step keeps it in the plan but skips it during interrogation, which is a way to keep a suspended check in the plan without deleting it. Briefs are covered in more detail in Chapter 4.
14.10 Summary
Pointblank gives you a way to present results for each audience. The tabular report from get_tabular_report() is the Great Tables view for people, and get_dataframe_report() returns the same information as a data frame. You can share a report by writing it to an HTML file with write_raw_html(), and you can save the validation object itself with pb.write_file().
For looking into failures, get_step_report() shows one step with its failing rows, and get_data_extracts() returns those rows as data, with their original row numbers. The get_sundered_data() method splits the table into passing and failing parts. For other systems, get_json_report() returns everything as JSON. Step notes, retrieved with get_notes() and get_note(), hold extra information some checks record, and briefs and labels make reports easier for other readers to follow. The next chapter, Chapter 15, uses these results to produce overall quality scores.