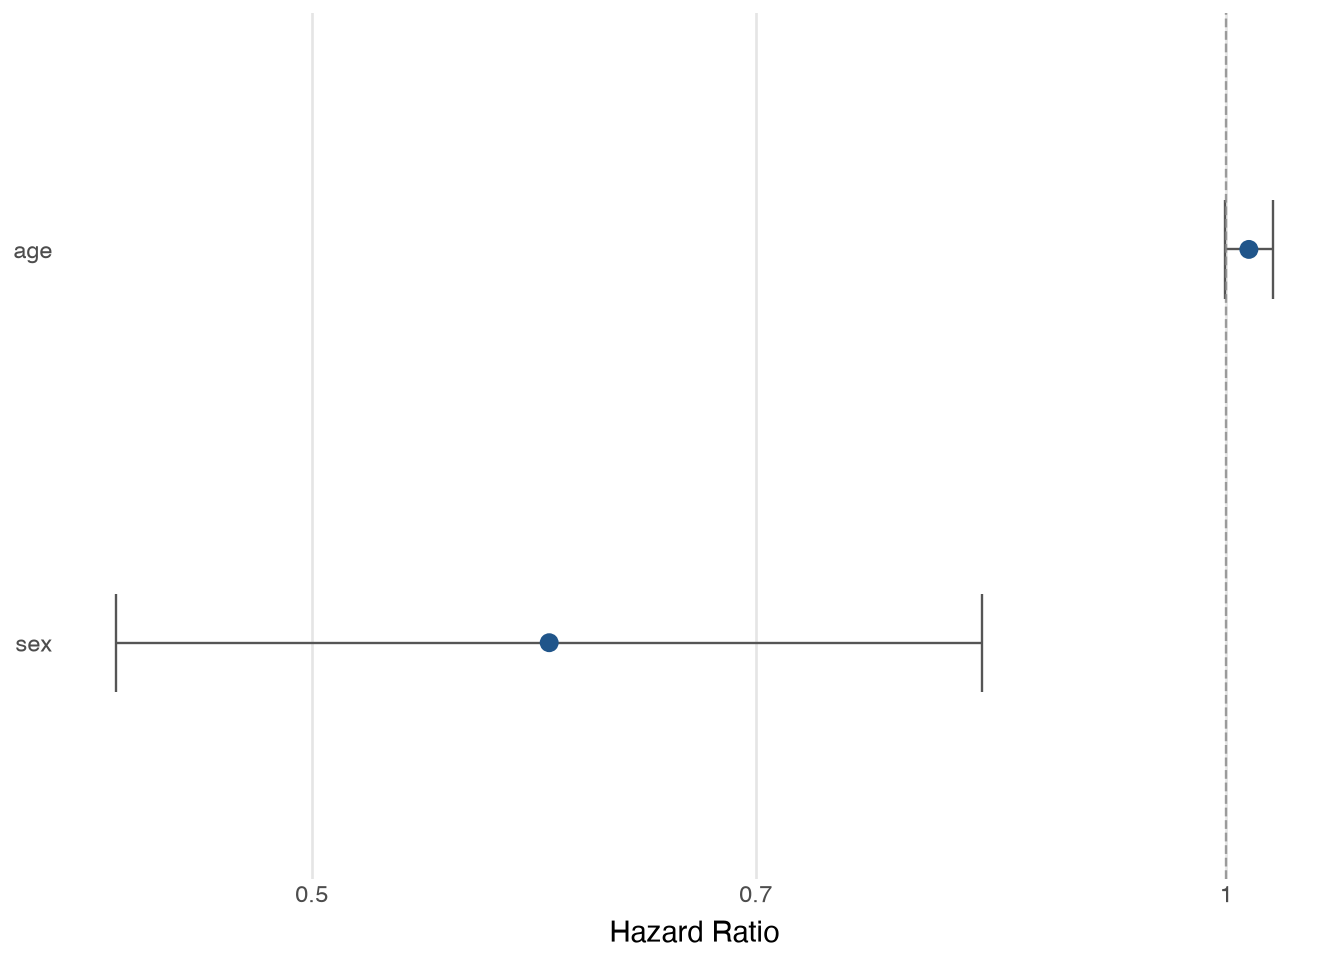
A minimal plotnine theme for forest plots.
Returns a composable plotnine theme object suitable for forest plots of hazard ratios or other contrasts. Horizontal grid lines are suppressed. The y-axis line is removed so the term labels stand alone.
Returns
plotnine.theme-
A composable theme object. Add it to a
ggplot with +.
Examples
Apply the forest theme to a forest plot of Cox model hazard ratios:
import greenwood as gw

# Load data and fit a Cox model with two covariates
lung = gw.load_dataset("lung", backend="polars")
y = gw.Surv.right(lung["time"], event=(lung["status"] == 2))
cox = gw.CoxPH().fit(y, lung[["age", "sex"]])

# Draw a forest plot and apply the minimal forest theme
gw.plot_forest(cox, backend="plotnine") + gw.theme_forest()