GT Integration Demo
This demo shows the full pipeline: creating a table with Great Tables (Python), converting to gridwell IR, and rendering to multiple formats.
Python Code
from great_tables import GT, exibble
import gridwell

# Create a GT table with groups, stub, and header
gt = (
    GT(exibble.head(4), rowname_col="row", groupname_col="group")
    .tab_header(title="Exibble Sample", subtitle="First 4 rows")
    .tab_source_note(source_note="Source: great_tables package")
)

# Convert to gridwell IR
table = gridwell.parse_ir(gridwell.gt_to_ir(gt))

# Validate
errors = table.validate()
assert errors == []  # ✓ valid
Rendered Outputs
Exibble Sample
First 4 rows
| row | num | char | fctr | date | time | datetime | currency |
|---|---|---|---|---|---|---|---|
| grp_a | |||||||
| row_1 | 0.1111 | apricot | one | 2015-01-15 | 13:35 | 2018-01-01 02:22 | 49.95 |
| row_2 | 2.222 | banana | two | 2015-02-15 | 14:40 | 2018-02-02 14:33 | 17.95 |
| row_3 | 33.33 | coconut | three | 2015-03-15 | 15:45 | 2018-03-03 03:44 | 1.39 |
| row_4 | 444.4 | durian | four | 2015-04-15 | 16:50 | 2018-04-04 15:55 | 65100.0 |
Source: great_tables package
| Exibble Sample | |||||||
| First 4 rows | |||||||
| num | char | fctr | date | time | datetime | currency | |
|---|---|---|---|---|---|---|---|
| grp_a | |||||||
| row_1 | 0.1111 | apricot | one | 2015-01-15 | 13:35 | 2018-01-01 02:22 | 49.95 |
| row_2 | 2.222 | banana | two | 2015-02-15 | 14:40 | 2018-02-02 14:33 | 17.95 |
| row_3 | 33.33 | coconut | three | 2015-03-15 | 15:45 | 2018-03-03 03:44 | 1.39 |
| row_4 | 444.4 | durian | four | 2015-04-15 | 16:50 | 2018-04-04 15:55 | 65100.0 |
| Source: great_tables package | |||||||
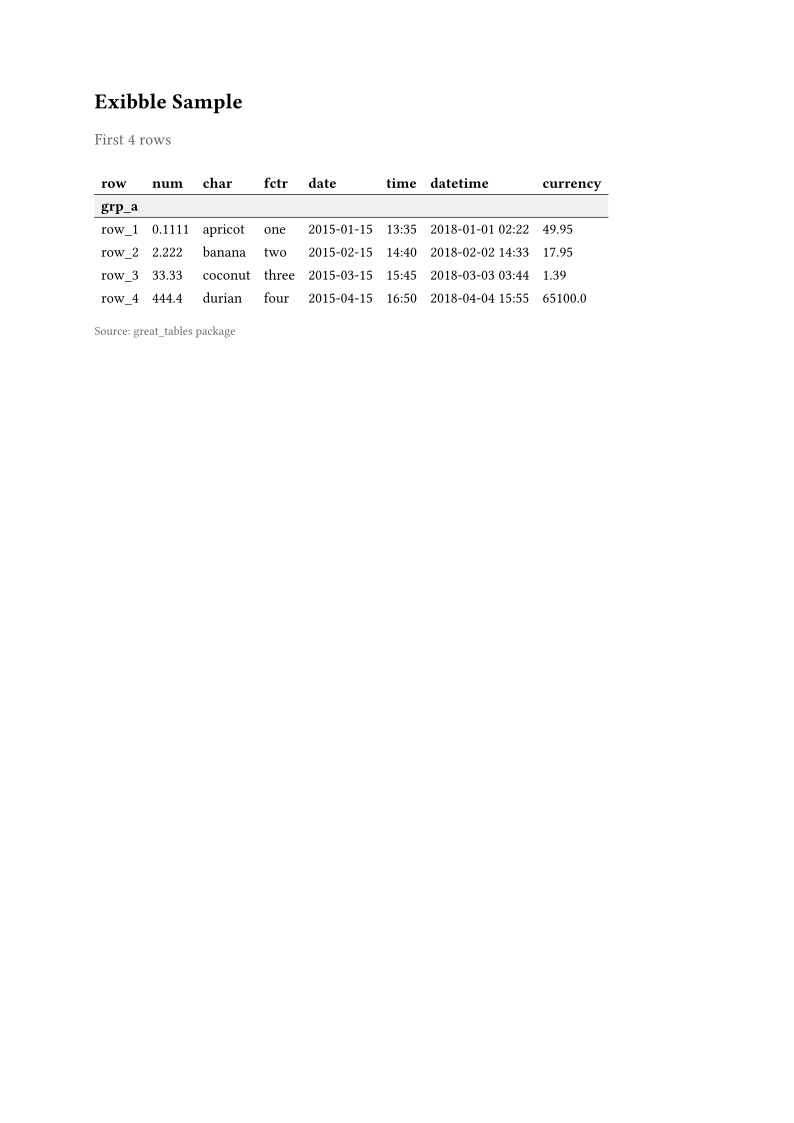
Exibble Sample
First 4 rows
┌────────────┬────────────┬────────────┬────────────┬────────────┬────────────┬──────────────────┬────────────┐
│    row     │    num     │    char    │    fctr    │    date    │    time    │     datetime     │  currency  │
├────────────┼────────────┼────────────┼────────────┼────────────┼────────────┼──────────────────┼────────────┤
│ grp_a                                                                                                      │
├────────────┼────────────┼────────────┼────────────┼────────────┼────────────┼──────────────────┼────────────┤
│   row_1    │   0.1111   │  apricot   │    one     │ 2015-01-15 │   13:35    │ 2018-01-01 02:22 │   49.95    │
│   row_2    │   2.222    │   banana   │    two     │ 2015-02-15 │   14:40    │ 2018-02-02 14:33 │   17.95    │
│   row_3    │   33.33    │  coconut   │   three    │ 2015-03-15 │   15:45    │ 2018-03-03 03:44 │    1.39    │
│   row_4    │   444.4    │   durian   │    four    │ 2015-04-15 │   16:50    │ 2018-04-04 15:55 │  65100.0   │
└────────────┴────────────┴────────────┴────────────┴────────────┴────────────┴──────────────────┴────────────┘
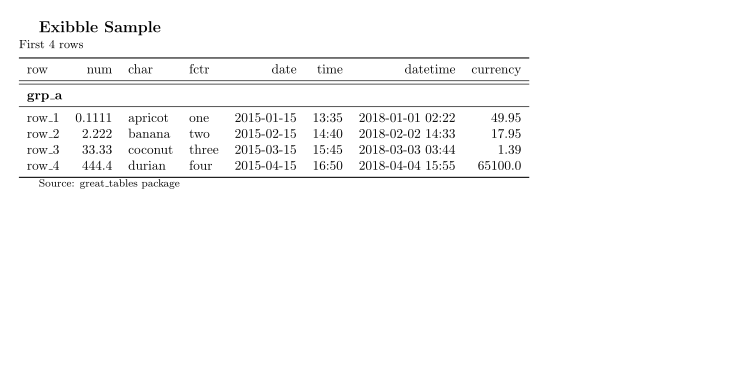
Source: great_tables package{\large\bfseries Exibble Sample}\\
{\small First 4 rows}\\[6pt]
\begin{tabular}{lrllrrrr}
\toprule
row & num & char & fctr & date & time & datetime & currency \\
\midrule
\multicolumn{8}{l}{\bfseries grp\_a} \\
\midrule
row\_1 & 0.1111 & apricot & one & 2015-01-15 & 13:35 & 2018-01-01 02:22 & 49.95 \\
row\_2 & 2.222 & banana & two & 2015-02-15 & 14:40 & 2018-02-02 14:33 & 17.95 \\
row\_3 & 33.33 & coconut & three & 2015-03-15 & 15:45 & 2018-03-03 03:44 & 1.39 \\
row\_4 & 444.4 & durian & four & 2015-04-15 & 16:50 & 2018-04-04 15:55 & 65100.0 \\
\bottomrule
\end{tabular}
{\footnotesize Source: great\_tables package}\\#align(left)[#text(size: 16pt, weight: "bold")[Exibble Sample]]
#align(left)[#text(size: 12pt, fill: luma(100))[First 4 rows]]
#v(6pt)
#table(
columns: (auto, auto, auto, auto, auto, auto, auto, auto),
stroke: none,
table.header(
[#text(weight: "bold")[row]], [#text(weight: "bold")[num]],
[#text(weight: "bold")[char]], [#text(weight: "bold")[fctr]],
[#text(weight: "bold")[date]], [#text(weight: "bold")[time]],
[#text(weight: "bold")[datetime]], [#text(weight: "bold")[currency]],
table.hline(stroke: 0.5pt),
),
table.cell(colspan: 8, fill: luma(240))[#text(weight: "bold")[grp_a]],
table.hline(stroke: 0.5pt),
[row_1], [0.1111], [apricot], [one], [2015-01-15], [13:35], [2018-01-01 02:22], [49.95],
[row_2], [2.222], [banana], [two], [2015-02-15], [14:40], [2018-02-02 14:33], [17.95],
[row_3], [33.33], [coconut], [three], [2015-03-15], [15:45], [2018-03-03 03:44], [1.39],
[row_4], [444.4], [durian], [four], [2015-04-15], [16:50], [2018-04-04 15:55], [65100.0],
)Text formats:
html: 1,197 chars
latex: 584 chars
typst: 819 chars
rtf: 1,842 chars
svg: 5,120 chars
ansi: 1,480 chars
pandoc: 28,400 chars
quarto: 35,200 chars
Binary formats:
docx: 1,945 bytes (valid Word 2007+)
xlsx: 3,057 bytes (valid Excel 2007+)
pptx: 4,346 bytes (valid PowerPoint 2007+)Performance
For a 1000-row × 10-column table (from Great Tables exibble expanded):
| Operation | Time |
|---|---|
Great Tables as_raw_html() |
~163 ms |
Gridwell render_html() (pre-parsed) |
~8.5 ms |
| Speedup (render only) | ~19× |
Note
The gridwell render is pure Rust. The IR emission step (Python → JSON) adds Python overhead, but once the IR is parsed, rendering is sub-millisecond for small tables and consistently faster than native Great Tables rendering for all sizes.