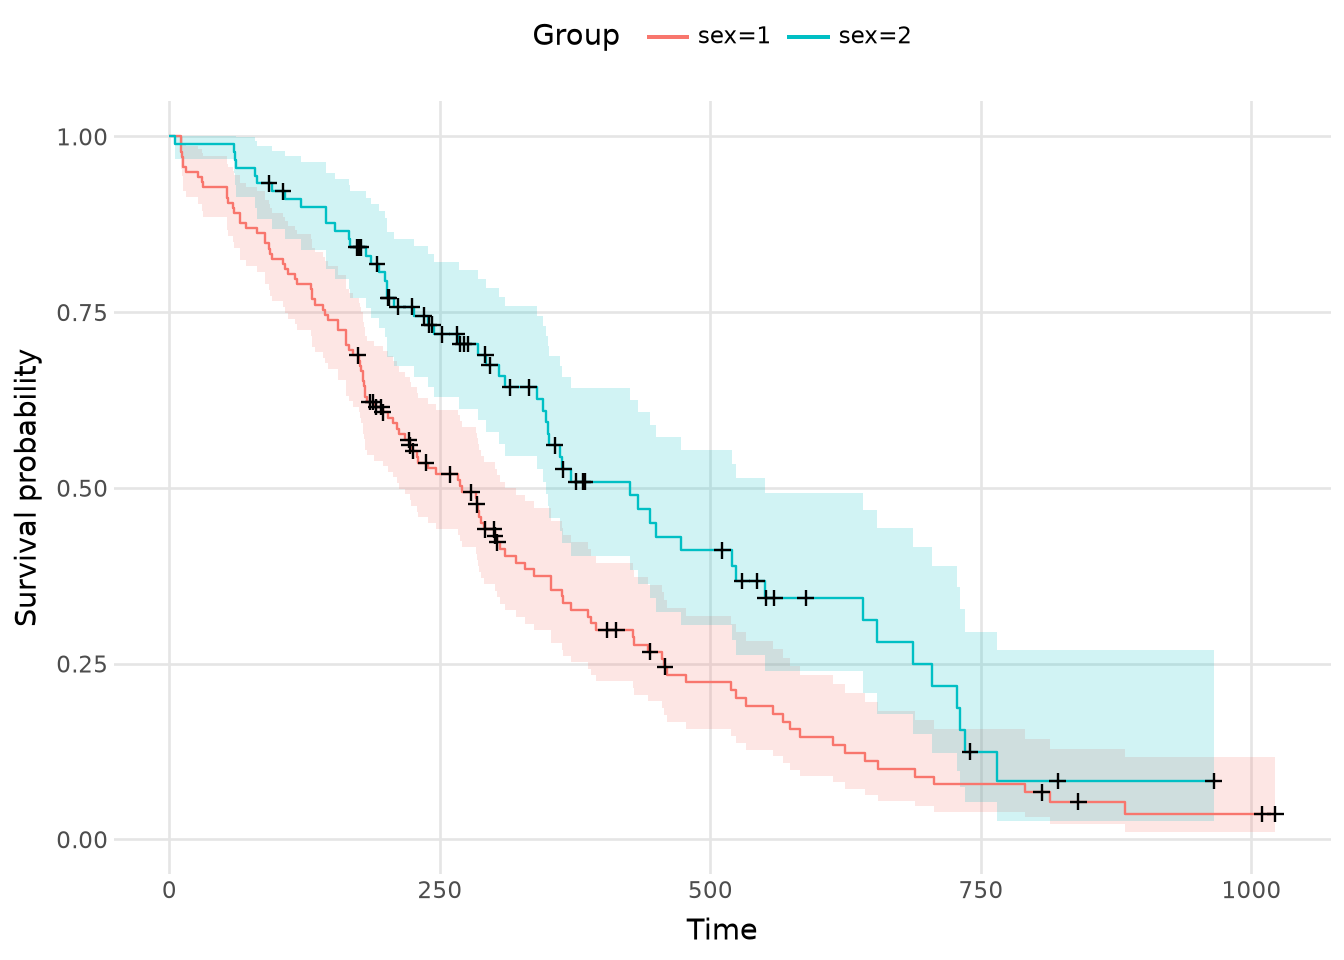
A light, publication-ready plotnine theme for survival plots.
Applies a minimal theme with the legend at the top and minor grid lines removed, giving survival curves a clean look suitable for journal figures.
Returns
plotnine.theme-
A composable theme object. Add it to a
ggplot with +.
Examples
Apply the survival theme to a Kaplan-Meier plot:
import greenwood as gw

# Load data and fit a stratified Kaplan-Meier estimator
lung = gw.load_dataset("lung", backend="polars")
km = gw.KaplanMeier().fit("Surv(time, status) ~ sex", data=lung)

# Apply the survival theme to the plot
gw.plot_survival(km, backend="plotnine") + gw.theme_survival()